PROBIS
Book a demo
For Asset Managers

One Portfolio. Complete Visibility. Better Capital Decisions.

Track capital expenditures, monitor project performance, and identify financial risks across your real estate portfolio, all in one connected platform. Make faster, data-driven decisions that protect asset value and improve portfolio performance.

+25%
Cost savings on indirect construction costs through standardized, automated processes
Portfolio

Sixty projects, one number.

Every project is consolidated in real time and ready for review by committees.

app.prob.is/asset/portfolio
Portfolio Overview
Live
Spent so far
Approved Budget
60
Projects in a live instance
40+
Deprecated Tables
1
Live figure, ready for committee review
CapEx / OpEx

Every asset on the same basis.

CapEx and OpEx are tracked per asset, making them directly comparable.

app.prob.is/asset/capex-opex
Asset Comparison
Live
CapEx
OpEx
Asset A
Asset B
Asset C
Asset D
Asset E
60
Consolidated Projects
Month 1
When Underperformance Is Flagged
1
Uniform Basis per Asset
Projects

Poor performance right from the first month.

A project that falls behind schedule is flagged that same month.
app.prob.is/asset/schemes
Project Details
1 marked
On Schedule
Project A
On Schedule
Project B
Selected
Project C
Marked in the same month
On Schedule
Project D
4
Projects Displayed
1
Marked for review
Live
Consolidated View
Selected Project

Experience PROBIS on a real-world project

Germany

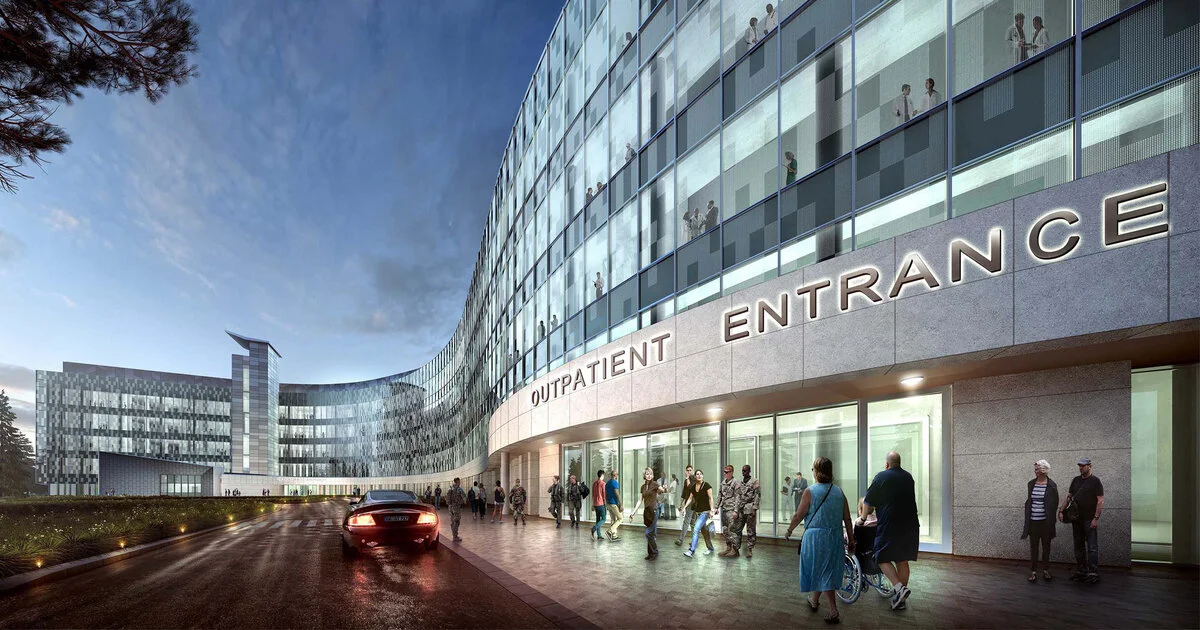
Group-wide hospital developments on a single platform.

Full rollout across all hospital development projects, with an interface to each project.
All
The Group's Hospital Developments
Göttingen, Germany

Data exchange without redundancy, right from day one.

A healthcare real estate operator uses PROBIS for centralized financial management and replaces fragmented spreadsheets with DATEV-integrated, audit-ready reporting.

The Answer

Turn fragmented data into portfolio -wide financial clarity.

A Portfolio Dashboard

PROBIS offers a portfolio dashboard where investment planning continues beyond the approval stage, CAPEX and OPEX are tracked for each asset, and input from all project teams is incorporated into a forecast ready for presentation to the board.

→
AI Consolidation

The AI consolidates the input from all project teams into a forecast that’s ready for committee review and approval, so you get today’s answer—not a slide from next month.

Where the problem lies today

Eliminate blind spots across the entire portfolio .

Each project team reports in its own format, so the portfolio data presented to your committee is always weeks old.

Manual Consolidation
60 files

The cost data for each project is stored in its own file, in its own format, and at its own pace, so consolidation is a spreadsheet exercise, not a report.

The Moving Target
Apples and Peaches

CapEx and OpEx are accounted for differently from project to project, so comparing portfolios is like comparing apples to oranges.

The Late Signal
End of the quarter

A below-average asset usually doesn't stand out until the end of the quarter, not during the month when it began to slip.

The Reactive Investor Call
Weeks old

Questions from the board and investors come faster than a manual forecast can answer them.

Click on an issue to explore it.
Inbox › Scheme_Rollup_Q3_v9.xlsx
Projects
60
Custom Formats
Files
60
Your Own Rhythm
An answer
None
—
VERSION
9
Consolidation vs. the Committee: Weeks Ago
ProjectFiles Due
ConsolidationVersion 9
CommitteePresents
ERP · An ERP Project
Rhythm
Monthly
Cost Categories
≠ Custom structure
CapEx vs. OpEx
≠ Separated
ERP › One instance per project, no connection
ERP · A Different ERP Project
Rhythm
Quarterly
Cost Categories
≠ Different structure
CapEx vs. OpEx
≠ In summary
≠

CapEx and OpEx are accounted for differently from project to project, so comparing portfolios is like comparing apples to oranges.

PDF › Board Presentation for the Last Quarter
When Underperformance Becomes Apparent: Portfolio View
Month 1Month 2End of the quarter UNSEEN UNTIL THE ROLL-UP Starts to slip Spotted at the end of the quarter
Plan
Asset Performance
Email › "I need this by tonight, sorry"
ContentStatusSource
Project ConsolidationVersion 9Excel
Committee Presentationlast quarterPDF
Project CostsOne ERP system per projectERP
The Investor QuestionTodayEmail · Tonight
Weeks

old: the portfolio figure presented to your committee when the investor call takes place.

Four systems, four versions of the truth —and no one knows for sure which one is current.

app.prob.is/asset/onboard
Project Onboarding · In Progress
Create a New Project
Draft
0
Projects Featured So Far
60
Planned Projects in Onboarding
Draft
Status Structure
Every project is organized into a structure before any figures are reported.
app.prob.is/asset/capex-opex
CapEx / OpEx · Consolidated View
Asset Comparison
Live
60
Consolidated Projects
Month 1
Significant Underperformance
1
Uniform Basis
Every project is measured consistently and updated in real time.
app.prob.is/asset/report
Investor Reporting · This Quarter
Committee Report
Shipped
1
Live count, no rebuild
60
Projects Recorded
0
Manual Consolidations
Reporting to governing bodies and investors is based on the same real-time view that your team relies on.
In practice

One consistent financial view across every Asset.

01

Onboarding the portfolio

Each project's chart of accounts is converted into a structure without having to rebuild existing processes.

02

Consolidate Automatically

Cost and CapEx data are consolidated into a single live view on a project-by-project basis.

03

Compare on a consistent basis

Each asset is benchmarked on the same basis, so underperformance in the same month becomes apparent.

04

Report from a number

Reporting to governing bodies and investors is based on the same real-time view that your team is already familiar with.

The Platform

One platform. Six modules. Designed for asset managers.

A connected platform, a real-time database. AI-powered, SAP-ready.

Calculate

Re-evaluate a CapEx plan in exactly the same way it was modeled.

Feasibility
DIN 276
Scenario Comparison

Contract

View all contractor relationships across the entire portfolio, not just for a single asset.

AI Contract Analysis
Change Orders
Invoice Automation

Control

Track budget vs. actual for CapEx and OpEx, asset by asset.

Budget vs. Actual
Deviation Reports
KPI Comparison

Rent & Sell

Monitor rental performance against the plan, project by project.

Sales Forecast
Revenue Control
Margin Call

Manage

Generate investor and committee reports based on live portfolio data.

Reporting Ready for Board Review
Milestone Trends
Payment Instructions

Portfolio

Most Used

Consolidate 60 projects into a single figure without manual merging.

Benchmarking
Standardized Structures
Portfolio Risk

Portfolio is the module where asset managers spend most of their time on a daily basis—more on that below.

In Focus: Portfolio

Every asset. Every project. One financial view.

The module that asset managers use every day: every project is tracked on the same basis, so that any deviation becomes visible in the month it occurs, rather than only in the quarter in which it is reported.

app.prob.is/asset/portfolio-detail
Portfolio · 4 of 60 projects displayed
Portfolio
Live
On Schedule
Selected
60
Projects in a live instance
40+
Deprecated Tables
1
Live figure, ready for committee review
This view includes 60 projects—without any manual consolidation.
Results

Better Visibility. Smarter Capital Allocation.

Published client results for owners and asset managers, in addition to changes in an ongoing portfolio.

+25%
Cost savings on indirect construction costs through standardized, automated processes
60
Projects in a live instance, not in 60 tables
40+
Discontinued Tables by Portfolio
Month 1
When a below-average asset is now flagged

Before: 60 tables, no clear answer → After: 1 consolidated live view

References

Familiar with portfolios on both sides of the Atlantic.

Owners and investment managers who consolidate their portfolios using PROBIS.

Featured Project · Savanna

110 William Street, New York.

A historic 32-story office building in Lower Manhattan is being renovated for the NYC Administration for Children's Services; PROBIS is providing the digital monitoring platform and monitoring services.

Buildings
32 stories, Lower Manhattan
Renovated Area
640,744 sq ft
Tenant
NYC Administration for Children's Services
app.prob.is/projects/110-william-street-new-york
110 William Street, New York
Featured Project · Owner's View
110 William Street
New York
32
Projectiles
640.744
Modernized sq ft
1918
Year of manufacture (expanded in 1959)
Monitoring platform and monitoring services for a high-rise building in Manhattan built in 1918, which has been modernized for municipal services.
Further projects

NIVEA's headquarters is building its new innovation center in Hamburg.

Beiersdorf AG is a Hamburg-based consumer goods company known internationally for its skin and personal care brands, such as NIVEA, Eucerin, and La Prairie, as well as for tesa's adhesive tape business.


1882
Founded in Hamburg
34,000 m²
Former factory site to be transformed into a neighborhood with up to 850 apartments
~700 million euros
Total Investment by the TROMA Foundation in the Neighborhood

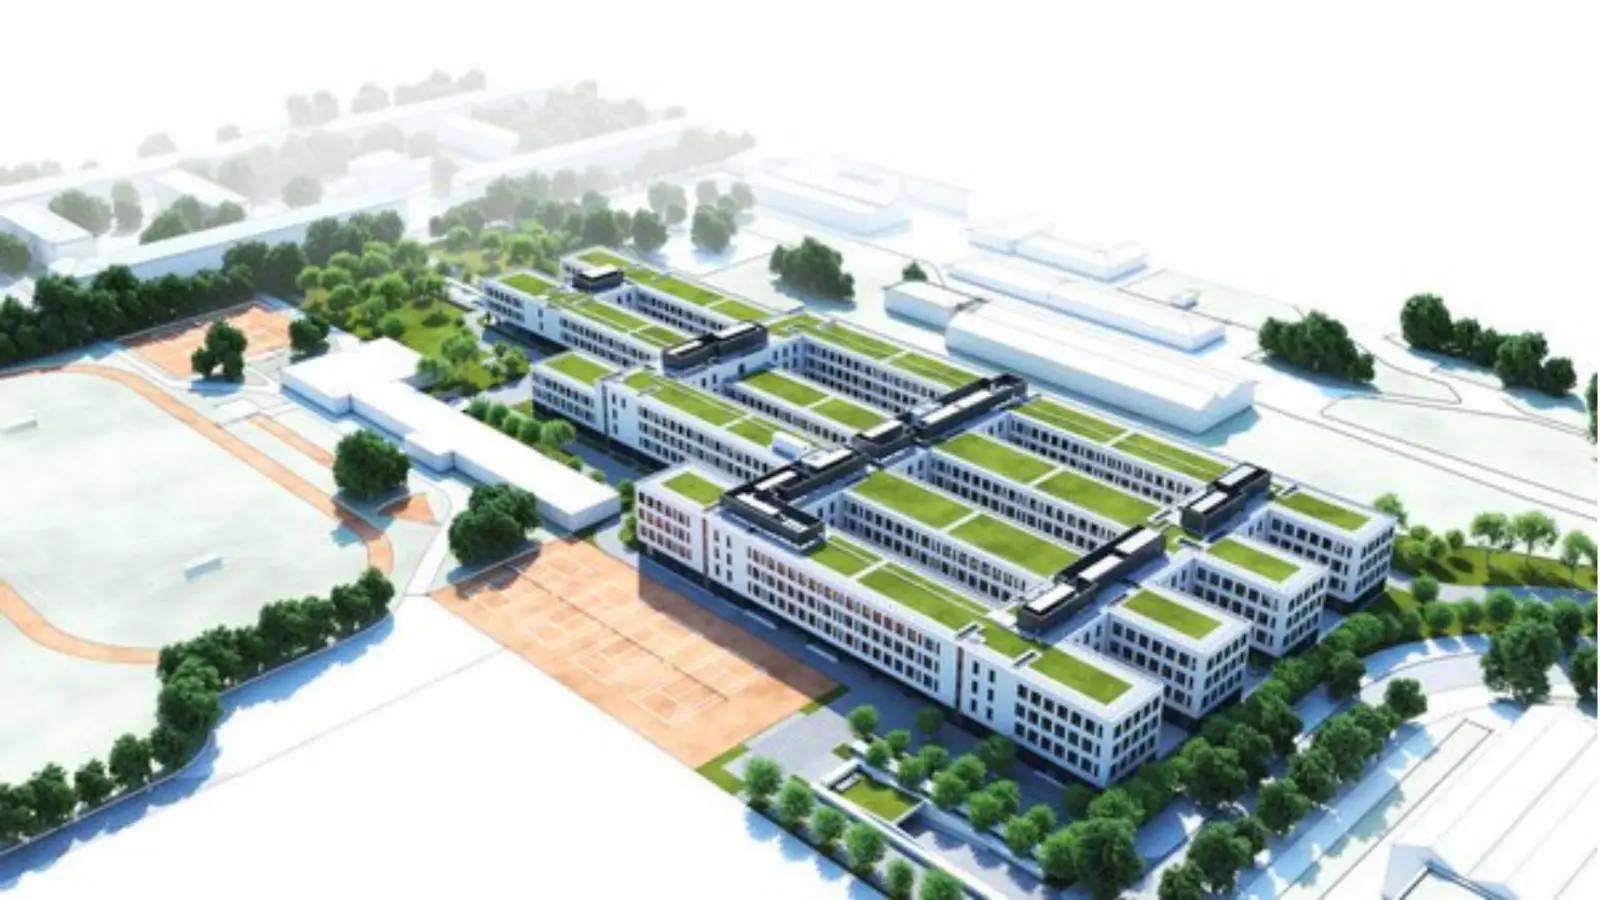
Facilities designed for a production process that never stops.

The BMW Group is a premium automaker headquartered in Munich that owns the BMW, MINI, Rolls-Royce, and BMW Motorrad brands and operates a global production network.

2.463.681
Vehicles Delivered in 2025
133.5 billion euros
Revenue in 2025
32
Production facilities in 15 countries

A historic industrial site is being transformed into a new urban neighborhood.

Siemens is a global leader in electrification, automation, and digitalization, operating in nearly every industry worldwide.


1847
Founded
76 ha
Area of the “Siemensstadt Square” urban district in Berlin-Spandau
3.750
Planned Housing Units in the Neighborhood
Next Step

Ready to Take Control of Your Portfolio's Financial Performance?