PROBIS Calculate uses templates, versions, and scenarios to forecast costs and revenue in order to identify the most profitable option, and then generates ongoing budget and revenue forecasts.
PROBIS integrates directly with SAP, MS Dynamics, Oracle, and Yardi, providing the key metrics you need without disrupting your operations.

Munich Tower II
| 300 Building Structures | €42,93M |
| 100 land | €17,14M |
| 400 Mechanical, Electrical, and Plumbing (MEP) Systems | €11,21M |
| 700 Construction-Related Expenses | €5,77M |
| Total project costs | €80,95M |
Every assessment has a critical point. PROBIS Calculate highlights it and then uses the model as a binding basis for the budget, which all stakeholders use as a guide.
PROBIS integrates directly with SAP, MS Dynamics, Oracle, and Yardi, providing the key metrics you need without disrupting your operations.
Austin Tower II
| 300 Building Shell | $49.59M |
| 100 Countries | $19.80M |
| 400 Building Services (MEP) | $12.95M |
| 700 Soft Costs | $6.67M |
| Total project cost | $93.50M |
PROBIS Calculate uses your key figures to generate a pro forma statement, allows you to adjust each assumption, and compares costs, revenues, and financing—before a scenario becomes a budget.
Initial calculation based on areas, key figures, and benchmarks.
The cost estimate expands as the project progresses, from cost groups down to individual line items.
Costs, Revenues, and Financing in an Integrated Model.
Time-based allocation of costs and revenues for reliable planning.
Start with the key metrics that guide the project, such as €/m² of gross floor area or €/unit. Set target values, simulate scenarios, and develop a robust budget—from the concept phase through detailed planning.
Do you plan roughly or calculate each item in detail? Costs are structured and categorized, and any assumption can be adjusted at any time without having to rebuild the model.
Look beyond the costs: Compare them with the expected revenues and assess the financing needs for each scenario. Structured overviews support decision-making at every stage of the project.
Once a scenario is selected, automated forecasts keep it on track: deviations from the planned budget are visible in real time, not just in the next report.
PROBIS Calculate uses your key figures to generate a pro forma statement, allows you to adjust each assumption, and compares costs, revenues, and financing—before a scenario becomes a budget.
Initial calculation based on areas, key figures, and benchmarks.
The cost estimate expands as the project progresses, from cost groups down to individual line items.
Costs, Revenues, and Financing in an Integrated Model.
Time-based allocation of costs and revenues for reliable planning.
Start with the key metrics that guide the project, such as $/m² of gross floor area or $/unit. Set target values, simulate scenarios, and develop a robust budget—from the concept phase through detailed planning.
Do you plan roughly or calculate each item in detail? Costs are structured and categorized, and any assumption can be adjusted at any time without having to rebuild the model.
Look beyond the costs: Compare them with the expected revenues and assess the financing needs for each scenario. Structured overviews support decision-making at every stage of the project.
Once a scenario is selected, automated forecasts keep it on track: deviations from the planned budget are visible in real time, not just in the next report.
Create the project, select the cost catalog, and specify areas, VAT, currency, and calculation method
Import cost elements and costing bases from an existing template, or create them directly in the user interface.
Set up a schedule for each cost element and view the resulting cash flow.
Create and compare different scenarios, and identify the one you want to approve for implementation.
Approve the selected scenario and make it a binding budget in PROBIS Control—without having to re-enter any data.
Create the project, select the cost catalog, and specify areas, VAT, currency, and calculation method
Import cost elements and costing bases from an existing template, or create them directly in the user interface.
Set up a schedule for each cost element and view the resulting cash flow.
Create and compare different scenarios, and identify the one you want to approve for implementation.
Approve the selected scenario and make it a binding budget in PROBIS Control—without having to re-enter any data.
From a 76-hectare urban district to a Berlin landmark to a Platinum-certified office building. Select a project to learn more.
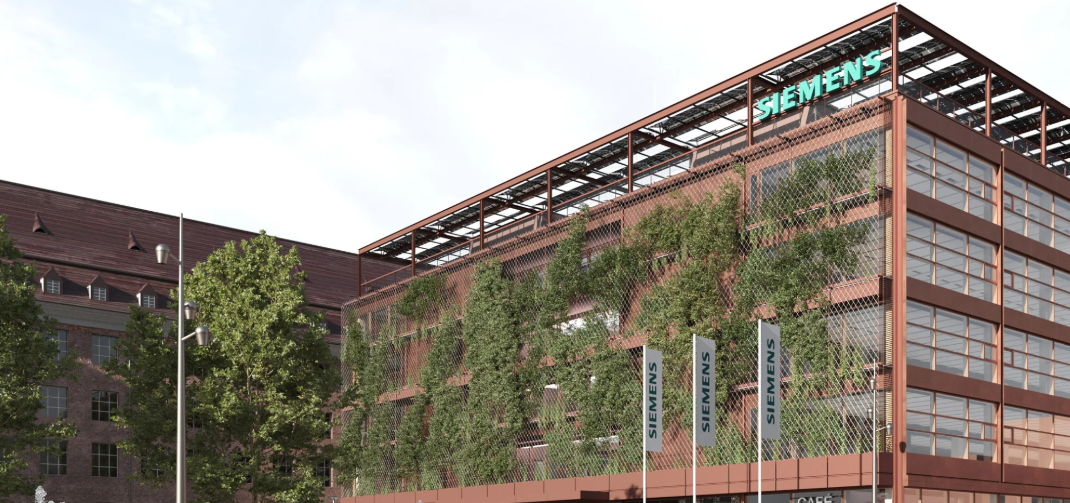
Siemens is transforming its historic industrial site in Berlin-Spandau into a mixed-use urban district featuring offices, approximately 3,750 apartments, a school, and an innovation campus—an investment worth billions across approximately 76 hectares. A project of this scale cannot be calculated like a single building: Each construction phase requires its own timeline, its own cost structure, and its own outcome. PROBIS Calculate maps out the neighborhood section by section; Contract and Control then carry that same structure forward into the procurement and implementation phases.
Read the full project profile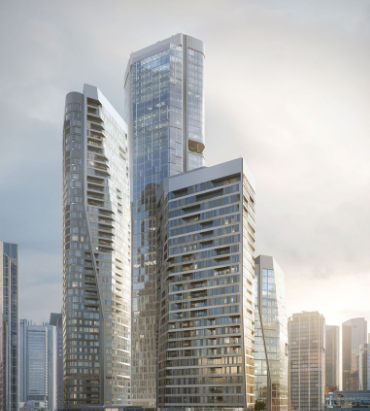
Cushman & Wakefield is relocating its German headquarters to Tower 1 of FOUR Frankfurt. The tower is approximately 233 meters tall, has 55 floors, a gross floor area of approximately 136,000 m², and features Germany’s highest office floor. PROBIS Calculate provides a quantity-based cost model for the project starting in the earliest planning phase; Contract and Control continue to use the same structure during the bidding and implementation phases.
Read the full project profile
The modernization of Jorge Chávez International Airport in Lima was not a single, linear construction project, but rather three parallel, interdependent phases: a new passenger terminal, a second runway, and a new control tower—together representing an investment of approximately 1.5 to 2 billion USD. The runway and control tower went into operation in April 2023, and the terminal opened in June 2025. PROBIS consolidates the three packages into a single view. Since Lima Airport Partners is a Fraport subsidiary, this view integrates seamlessly into the Group’s financial reporting.
Read the full project profile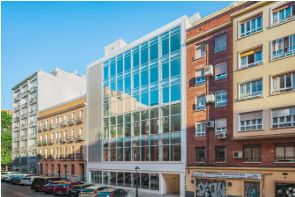
Vizcaya12 is an office building in the heart of Madrid that is aiming for LEED Platinum certification and the first WELL Platinum certification in the Madrid region. A highly transparent glass facade provides natural light to the flexible open-plan offices. Such goals drive up costs for the facade, building services, and interior finishes—which is why they must be included in the initial cost estimate rather than in a change order. PROBIS Calculate managed the cost model throughout the project period from 2021 to 2022.
Read the full project profile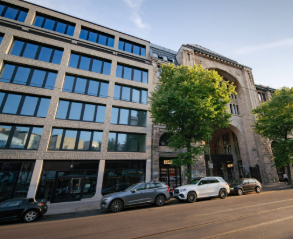
PWR Development has developed “Am Tacheles,” an 85,000 m² mixed-use neighborhood in Berlin-Mitte—featuring apartments, offices, and retail spaces. At the heart of the project is the Tacheles, the art museum and event center that has shaped Berlin’s cultural scene for years. A project like this cannot be measured by a simple average, as each use has its own costs, revenues, and risks. PROBIS supported the development from 2018 to 2023, using Calculate, Contract, and Control within a single cost structure.
Read the full project profileCopy the base scenario, adjust key assumptions, and compare results directly—all on a single screen. One project, multiple future scenarios—instead of four files with similar names.
Comparisons that stand the test of time.
A verifiable price floor.
A reproducible committee document.
| Key figure | Base Case | Costs +8% | Rental −2 Q | Combined |
|---|---|---|---|---|
| Project Margin | 14,2% | 9.8% | 11.6% | 6.1% |
| Residual land value | €20.2 million | 12.3 million euros | 17.5 million euros | 8.1 million euros |
| Financing Peak | €67.9 million | 73.6 million euros | 75.0 million euros | 81.5 million euros |
| Loan-to-Cost Ratio | 68% | 72% | 71% | 76% |
Copy the base case, adjust whatever concerns you, and compare the results side by side on the same screen. Not four files with similar names—one project, several possible outcomes.
Comparisons that remain valid.
A negotiating position you can substantiate.
A committee pack that’s reproducible.
| Metric | Base case | Cost +8% | Leasing −2Q | Combined |
|---|---|---|---|---|
| Project margin | 14.2% | 9.8% | 11.6% | 6.1% |
| Residual land value | $20.2M | $12.3M | $17.5M | $8.1M |
| Peak funding | $67.9M | $73.6M | $75.0M | $81.5M |
| Loan-to-Cost Ratio | 68% | 72% | 71% | 76% |
Complete cost and revenue structure in accordance with DIN 276, your own structure, or that of your client.
| Cost Group | Quantity | Unit | Unit Price | Total |
|---|---|---|---|---|
| 100 land | 4.200,00 | square feet | 4.714,29 | 19.800.000 |
| 200 Site Preparation & Development | 1,00 | psch | 2.035.000 | 2.035.000 |
| 300 Building Construction | 18.400,00 | m² gross floor area | 2.695,00 | 49.588.000 |
| 400 Technical Systems | 18.400,00 | m² gross floor area | 704,00 | 12.953.600 |
| 500 outdoor facilities | 2.200,00 | square feet | 495,00 | 1.089.000 |
| 600 Features | 1,00 | psch | 1.364.000 | 1.364.000 |
| 700 Construction-Related Expenses | 13,5 | % | — | 6.670.400 |
| Total (net) | 93.500.000 | |||
Complete cost and revenue structure according to DIN 276, your own structure, or that of your client.
| Cost category | Quantity | Unit | Unit rate | Total |
|---|---|---|---|---|
| 100 Countries | 45,208.00 | sq ft | 437.98 | 19,800,000 |
| 200 Sitework | 1.00 | LS | 2,035,000 | 2,035,000 |
| 300 Building Shell | 198,056.00 | sq ft GFA | 250.37 | 49,588,000 |
| 400 Building Services (MEP) | 198,056.00 | sq ft GFA | 65.40 | 12,953,600 |
| 500 Site Improvements | 23,681.00 | sq ft | 45.99 | 1,089,000 |
| 600 FF&E | 1.00 | LS | 1,364,000 | 1,364,000 |
| 700 Soft Costs | 13.5 | % | — | 6,670,400 |
| Grand total (net) | 93,500,000 | |||
A profitable project can fail due to timing issues. Schedule each element and view the cash flow directly from the model.
A profitable project can fail due to timing issues. Schedule each element and view the cash flow directly from the model.
The construction cost is the biggest risk at the beginning—start by using benchmarks from completed projects.
The construction cost is the biggest risk at the outset; start by using benchmarks from completed projects.
The highest land price at which your minimum return is still achieved.
Separate construction phases, each with its own timeline and outcome.
Margin and return using a two-variable matrix.
One entry-level model per product type and quality standard.
Capture the data your investment process needs—for every property.
Labeled, dated, reproducible.
Net and gross views are available throughout the system and are configured at the project level.
Import existing catalogs, cost elements, and structures using a template file.
The cost estimate summary that your committee actually reads.
Yes—as a rule, the existing model is imported rather than built from scratch. Cost catalogs, cost elements, and structures are imported via a template file. The difference is that the model is no longer separate from the project; instead, it becomes the budget—and remains up to date.
Yes. You specify a target margin or target return, and Calculate calculates the maximum land price—and updates it as soon as costs, revenues, or deadlines change.
Virtually unlimited. Scenarios are contained within the project and share its structure; creating an additional scenario does not generate a second file that needs to be maintained.
From completed projects in the PROBIS database, adjusted for region, type of use, and construction cost index—and, if available, from your own project history in the system.
Yes. Costs and revenues can be broken down by construction phase, type of use, and unit. A mixed-use project combining residential and retail space is therefore a project in which each use has its own separate financial viability.
We'll work with you to prepare the profitability analysis during our meeting and show you under what assumptions it no longer holds true.
Security & Compliance
Financial data for real estate projects must meet the requirements of lenders, investors, and regulatory authorities. Our risk management framework withstands even the most thorough scrutiny, going far beyond simple checklists.
