PROBIS
Book a Demo
Manage · Control

You'll find out. The only question is, how soon.

Manage covers multi-project and portfolio management, CapEx, OpEx, multi-year planning, and AI reporting. Users keep working in their existing Excel structures; AI transfers and structures the data in PROBIS, and Manage delivers the consolidated portfolio view and automated AI reporting.

Your existing ERP system remains in place. PROBISconnects directly to SAP, Yardi, Oracle, and MS Dynamics and retrieves the reports you need without interfering with your processes.

Schedule a demo
Portfolio Board — 3 of 9 projects · live · PROBIS Manage
Portfolio
Warnings
Decisions
Cash flow
Projects
9
Portfolio Budget
€1.36 billion
Open Warnings
7
Decisions Need to Be Made
6
Mainufer Tower II
Frankfurt
€203.1 million
Costs
Dates
Quality
Harbor District
Hamburg
€233.2 million
Costs
Dates
Quality
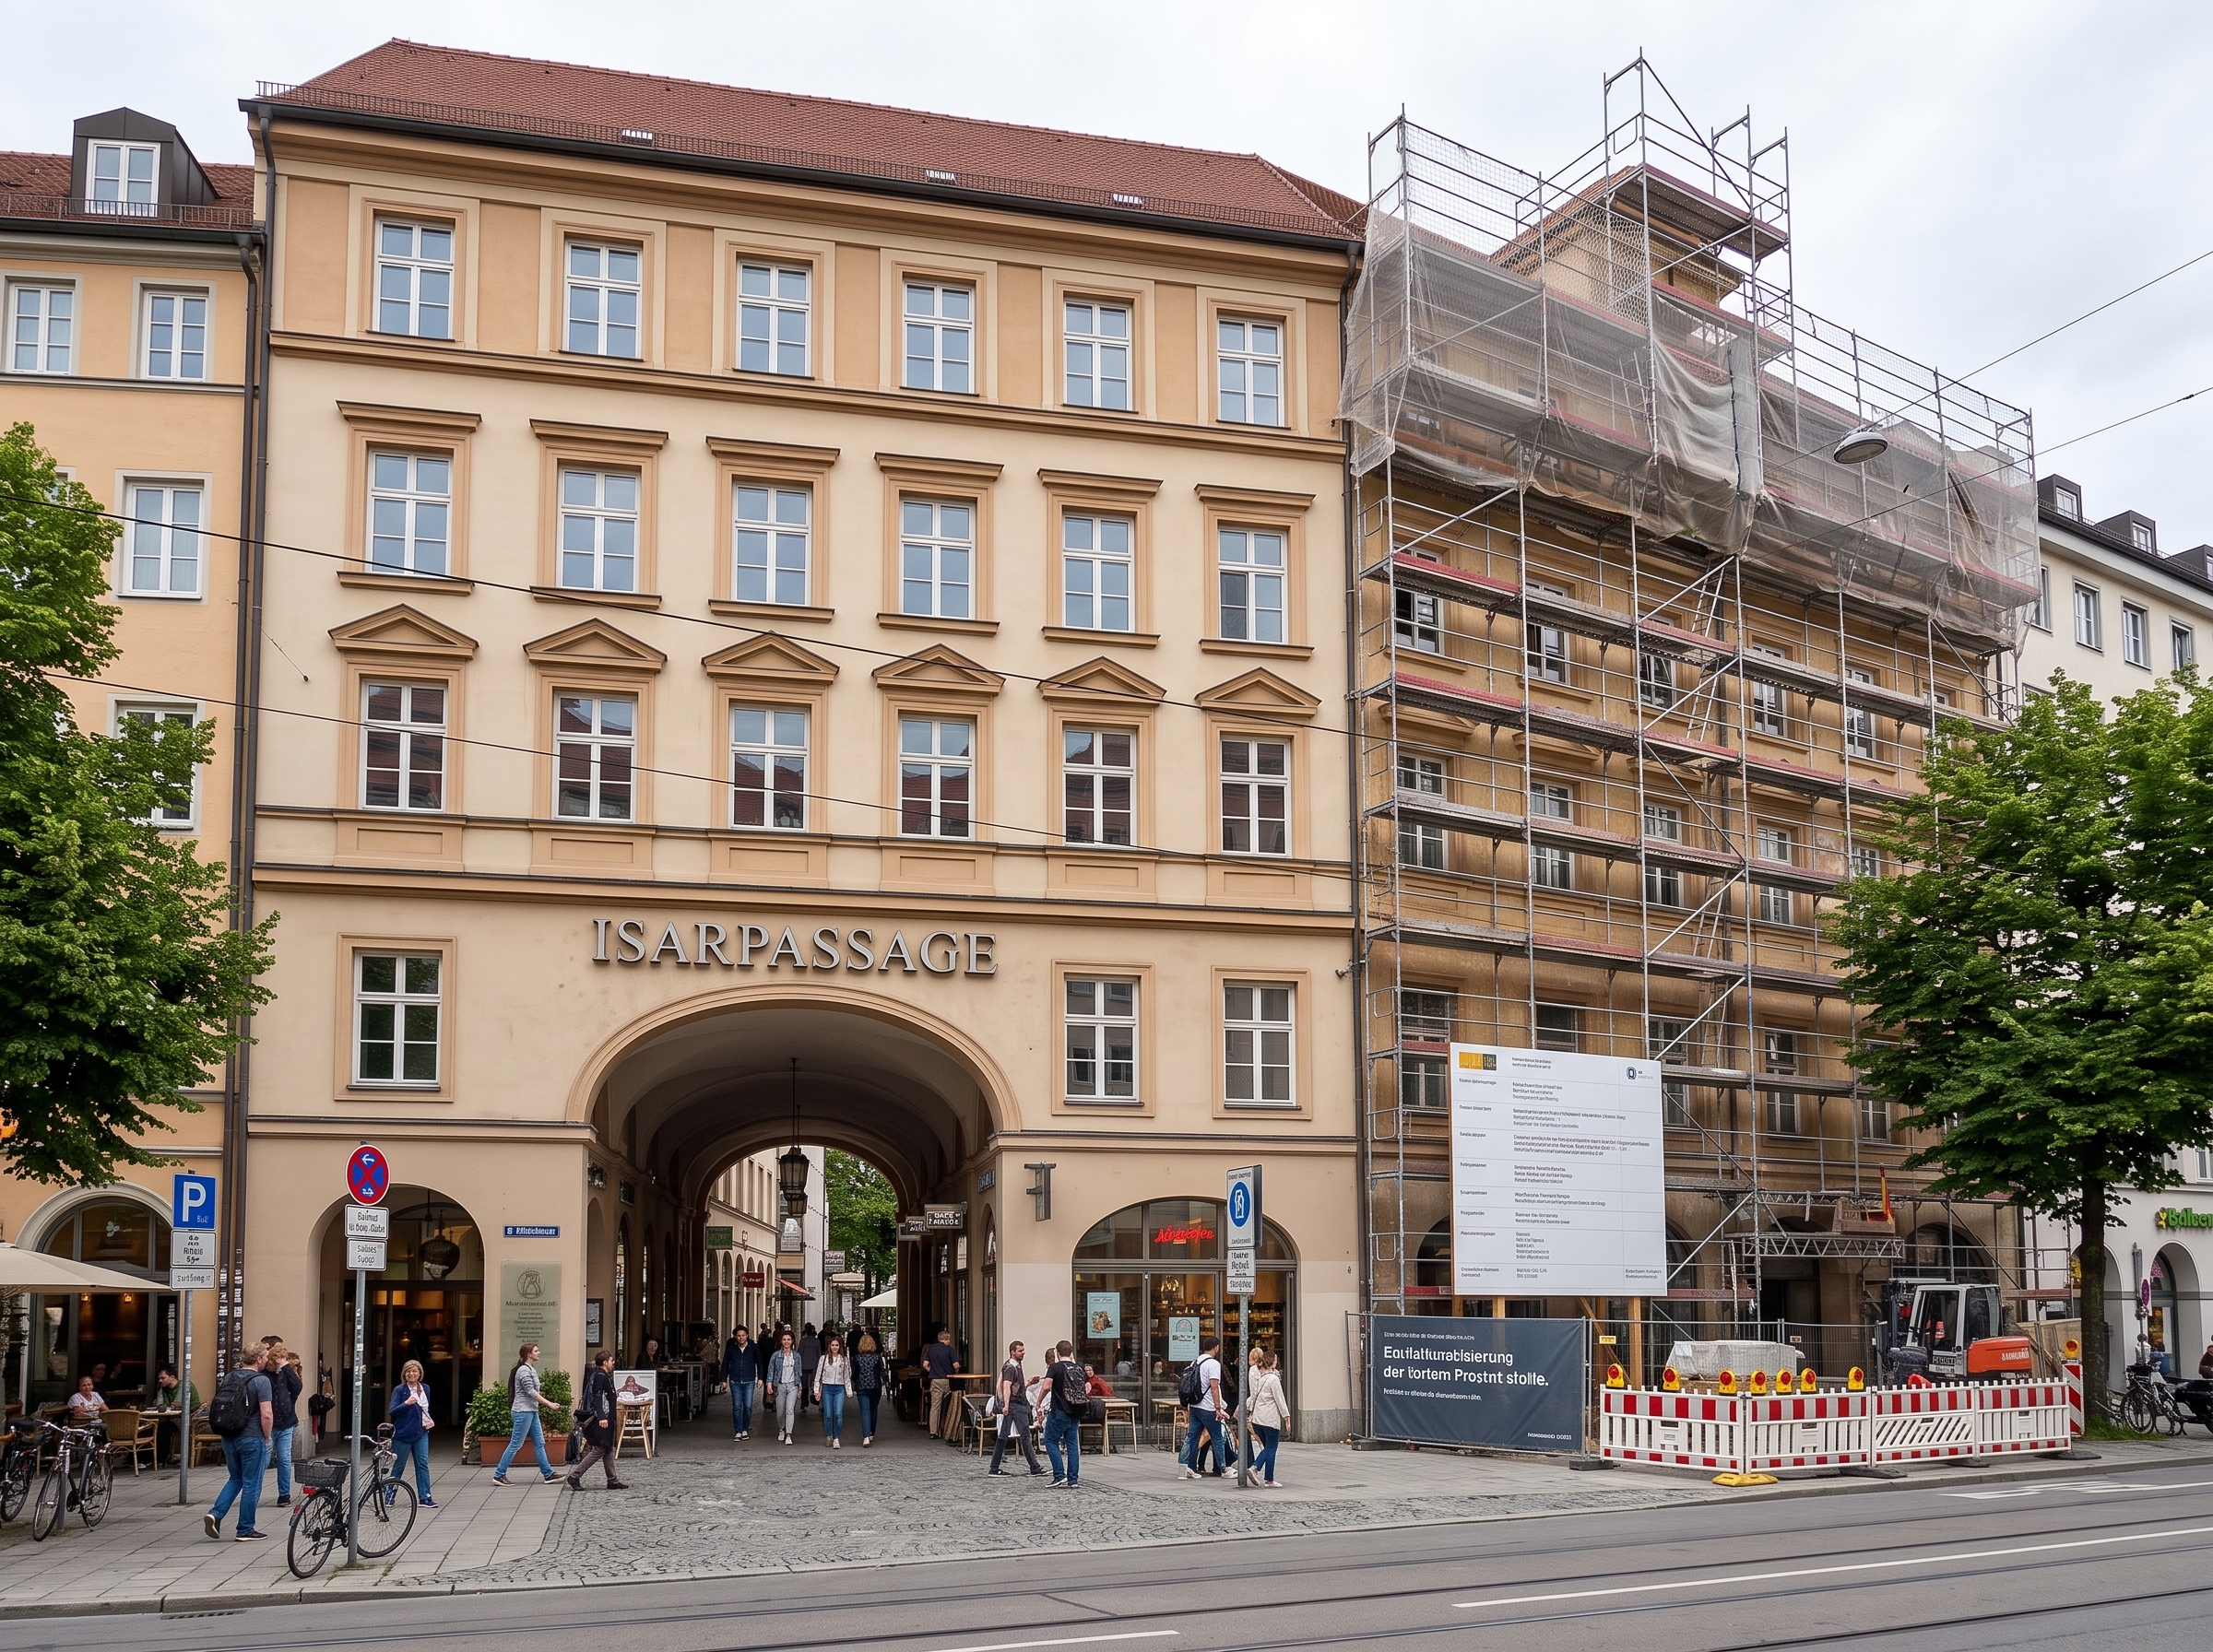
Isarpassage Revitalization
Munich
€106.0 million
Costs
Dates
Quality
Within the tolerance range
Threshold value is approaching
Warning triggered · Responsibility assigned
Mainufer Tower II

Mainufer Tower II

Frankfurt · Office

Harbor District

Harbor District

Hamburg · Mixed Use

Isar Passage

Isar Passage

Munich · Revitalization

Manage · Steering

You'll find out.
The only question is, how soon.

Manage covers multi-project and portfolio management, CapEx, OpEx, multi-year planning, and AI reporting. Users keep working in their existing Excel structures; AI transfers and structures the data in PROBIS, and Manage delivers the consolidated portfolio view and automated AI reporting.

Your existing ERP system remains in place. PROBIS connects instantly to SAP, Yardi, Oracle, and MS Dynamics to provide the insights you need without disrupting your workflow.

Book a DEMO
Portfolio Board — 3 of 9 projects · live · PROBIS Manage
Portfolio
Warnings
Decisions
Cash flow
Projects
9
Portfolio budget
$1.36B
Open warnings
7
Decisions Due
6
Riverside Tower II
Chicago
$203.1M
Cost
Time
Agony
Harbor District
Baltimore
$233.2M
Cost
Time
Agony
Peachtree Galleria Renovation
Atlanta
$106.0M
Cost
Time
Agony
Within tolerance
Threshold approaching
Warning raised · owner assigned
Riverside Tower II

Riverside Tower II

Chicago · Office

Harbor District

Harbor District

Baltimore · Mixed-Use

Peachtree Galleria

Peachtree Galleria

Atlanta · Refit

Early
Cash Flow · Liquidity · Benchmarking · AI Report Builder

Four Ways to Know Before It Becomes a Problem.

Cash Flow
Funds drawn down and peak financing in the portfolio, recalculated on an ongoing basis
Average monthly cash outflow per project, aggregated by program and company
The peak financing amount and financing costs are recalculated with each forecast
Discrepancy between planned and actual fund disbursement, reported by the person in charge
Allocated and unallocated costs shown separately for each period
Cash flow view in the format expected by the bank's construction finance team
Cash flow for the lending bank →
Portfolio Cash Outflow — Next 6 Months
9 projects · million euros
MonthPlanIsDeviationCoverage
Sept.45,348,2+2,9Discrepancy Reported · K. Hoffmann
Oct.49,1——5.1 months
Nov.52,7——4.8 months
Dec.50,9——4.6 months
Jan.47,4——4.3 months
Feb.43,7——4.1 months
Cash Outflow for 6 Months289,148,2+2,9Peak Nov.
Liquidity
Month-to-month funding coverage against committed credit lines
Monthly equity requirement based on committed credit lines rather than a flat quota
Coverage in months by project, company, and portfolio
Threshold levels for coverage trigger the warning about a month with a shortfall
Available credit limit visible for each tranche
Scenario Perspective: What a Four-Week Delay Means for Financing Needs
Liquidity for the financing bank →
Financing Coverage — Mainufer Tower II
Coverage in months · € million
MonthNeedsAvailableCoverageStatus
Month 22 · Sep.8,450,25,0Within
Month 23 · Oct.9,241,84,5Within
Month 24 · Nov.10,132,64,2Within
Month 25 · Dec.10,822,44,1Within
Month 26 · Jan.11,111,73,8Below the Threshold · K. Hoffmann
Month 27 · Feb.10,30,60,17. Drawdown required
Unsecured Line of Credit—50,25,0Covenant ≥ 4 months · 1 violation
Benchmarking
According to DIN 276 cost groups, regionally adjusted and index-adjusted
Comparability Based on Regional, Index, and Standard Adjustments
The difference broken down by cost category, not as a single figure
Outliers are flagged when a cost group drives the variance
Save comparison groups and reuse them in your portfolio
Benchmarks are factored into the calculation in Calculate and the quote review in Contract
View benchmark comparison →
Villa A vs. Group Average
€/m² gross floor area · adjusted for regional differences
Cost GroupVilla AØ GroupDelta
KG 330 Exterior Walls/Facade1.100924,0+19,0 %
KG 340–350 Interior Walls & Ceilings810647,0+25,2 %
KG 400 Technical Systems550528,0+4,2 %
Total €/m² of gross floor area3.3202.902,0+14,4 %
AI Report Builder
In use at JLL and the City of Ludwigshafen
Describe it once—the report generates itself and stays up to date
Generate each report on demand, based on the data sources of your choice
Select projects, cost estimates, contracts, and invoices as a basis
Completely rebuilt and ready to ship, without template maintenance
Stay up to date—the report updates as soon as new cost data becomes available
Every value can be traced back to the underlying transaction
Monthly Variance Report — 3 Projects
Live · Updated 2 minutes ago
"Monthly Variance Report for Mainufer Tower II, Hafenquartier, and Hafenquartier Construction Lot E5 – Budget vs. Forecast by Cost Category, including all change orders exceeding €250,000."
Cost Estimates
Contracts
Invoices
ProjectBudgetForecastDeviationStatus
Mainufer Tower II203,1206,2−1,5 %Created
Harbor District233,2243,0−4,2 %Created
Hafenquartier Construction Lot E5295,1318,1−7,8 %Created
Total: 3 projects731,4767,3−4,9 %Updates itself

View Audit and Governance →

Early
Cash Flow · Liquidity · Benchmarking · AI Report Builder

Four Ways to Know Before It Becomes a Problem.

Steering consists of a small number of decisions made early enough to make a difference. Manage breaks this down into four components—the cash outflow, the funding source, the target figure, and the report that substantiates it. Each component triggers a threshold alert—with a designated owner and a deadline—before the decision becomes costly.

Cash Flow
Funds drawn down and peak financing in the portfolio, recalculated on an ongoing basis
Average monthly cash outflow per project, aggregated by program and company
The peak financing amount and financing costs are recalculated with each forecast
Discrepancy between planned and actual fund disbursement, reported by the person in charge
Allocated and unallocated costs shown separately for each period
Cash flow view in the format expected by the bank's construction finance team
Cash flow for the lending bank →
Portfolio cash-out — next 6 months
9 projects · $M
MonthPlannedActualVarianceCover
Sep45.348.2+2.9Drift Raised · A. Sullivan
Oct49.1——5.1 months
Nov52.7——4.8 months
Dec50.9——4.6 months
Jan47.4——4.3 months
Feb43.7——4.1 months
Six-Month Cash-Out289.148.2+2.9Peak Nov
Liquidity
Month-to-month funding coverage against committed credit lines
Monthly equity requirement based on committed credit lines rather than a flat quota
Coverage in months by project, company, and portfolio
Threshold levels for coverage trigger the warning about a month with a shortfall
Available credit limit visible for each tranche
Scenario Perspective: What a Four-Week Delay Means for Financing Needs
Liquidity for the financing bank →
Funding Cover — Riverside Tower II
Months of coverage · $M
MonthRequirementAvailableCoverStatus
Month 22 · Sep8.450.25.0Within
Month 23 · Oct9.241.84.5Within
Month 24 · Nov10.132.64.2Within
Month 25 · Dec10.822.44.1Within
Month 26 · Jan11.111.73.8Below Threshold · A. Sullivan
Month 27 · Feb10.30.60.1Advance 7 required
Remaining capacity—50.25.0Covenant ≥ 6 flagged
Benchmarking
By UNIFORMAT cost groups, regionally, and adjusted for inflation
Comparability Based on Regional, Index, and Standard Adjustments
The difference broken down by cost category, not as a single figure
Outliers are flagged when a cost group drives the variance
Save comparison groups and reuse them in your portfolio
Benchmarks are factored into the calculation in Calculate and the quote review in Contract
View benchmark comparison →
Villa A vs. the set average
$/sf · regionally adjusted
Cost groupVilla ASet avgDelta
Superstructure123102.5+19.9%
Interior Finishes9071.8+25.3%
Services6158.6+4.1%
Total $/sq ft369321.8+14.7%
AI Report Builder
In use at JLL and the City of Ludwigshafen
Describe it once—the report generates itself and stays up to date
Generate each report on demand, based on the data sources of your choice
Select projects, cost estimates, contracts, and invoices as a basis
Completely rebuilt and ready to ship, without template maintenance
Stay up to date—the report updates as soon as new cost data becomes available
Every value can be traced back to the underlying transaction
Monthly Variance Report — 3 Projects
Live · last updated 2 minutes ago
"Monthly variance report for Riverside Tower II, Harbor District, and Seaport Block E5 — budget vs. forecast by cost code, with change orders over $250K highlighted."
Cost estimates
Contracts
Invoices
ProjectBudgetForecastVarianceStatus
Riverside Tower II203.1206.2−1.5%Compiled
Harbor District233.2243.0−4.2%Compiled
Seaport Block E5295.1318.1−7.8%Compiled
Total for the three projects731.4767.3−4.9%Auto-updating

View Audit and Governance →

Cash Flow + Liquidity · For the Lending Bank

Can you review the funding request before approving it?

Each fund drawdown answers three questions: Are the funds being directed where the financing plan specifies? Have the disbursement requirements for this tranche been met? Will the report stand up to scrutiny by the committee? PROBIS answers all three questions using a database owned by the bank—not the borrower’s spreadsheet.

  • Fund usage is monitored by financing phase, with an automatic equity statement that verifies compliance with the agreed-upon sequence.
  • Emissions and covenants as a running register, with the document associated with each emission and each documented waiver.
  • Construction progress is measured against payments, so that funds disbursed never exceed the construction work completed.
  • Reports generated for any given date —with attached documents, not re-entered.
Payment Package · 6th Disbursement — Mainufer Tower II
Source and Use of Funds · € million
Created on September 8, 2026 · Version for the bank
Source of FundsCommitmentRetrievedThis drawdownRemainingExam
Equity61,661,6—0,0Audited · Equity has priority
Senior Loans123,286,29,427,6LTC 68.4% · within
Mezzanine17,64,4—13,2Not accessed
Construction Progress vs. Payment
Construction Progress vs. Funds Disbursed
Construction Progress44.1%
Funds Disbursed42.6%
PositionPayment is in progress · not critical
Covenants Reviewed This Month
3 reviewed · 1 reported
Loan-to-Cost ≤ 70%Is 68.4%Within
Equity Capital Takes PrecedenceFully incorporatedWithin
Funding coverage ≥ 4 months3.8 months as of January 2027Reported · K. Hoffmann
Each line item can be traced back to the underlying invoice
Export Bank Package
There are systems on the market that generate financing reports. These are created within the borrower's environment. PROBIS operates on the lender’s side of the transaction.
Cash Flow + Liquidity · For the Lending Bank

Can you review the funding request before approving it?

Each fund drawdown answers three questions: Are the funds being directed where the financing plan specifies? Have the disbursement requirements for this tranche been met? Will the report stand up to scrutiny by the committee? PROBIS answers all three questions using a database owned by the bank—not the borrower’s spreadsheet.

  • Fund usage is monitored by financing phase, with an automatic equity statement that verifies compliance with the agreed-upon sequence.
  • Emissions and covenants as a running register, with the document associated with each emission and each documented waiver.
  • Construction progress is measured against payments, so that funds disbursed never exceed the construction work completed.
  • Reports generated for any given date —with attached documents, not re-entered.
Draw Package · Advance 6 — Riverside Tower II
Sources and Uses · $M
Generated Sep 8, 2026 · monitor copy
SourceFacilityDrawnThis advanceRemainingVerification
Equity61.661.6—0.0Verified · equity-first
Senior debt123.286.29.427.6Within LTC 68.4%
Mezzanine17.64.4—13.2Undrawn
Progress vs. Disbursement
Work in place vs. funds released
Work in place44.1%
Funds Released42.6%
PositionBehind draw · clear
Covenants Tested This Month
3 tested · 1 flagged
Loan-to-cost ratio ≤ 70%Actual 68.4%Within
Equity-first sequenceFully contributedWithin
Funding to cover at least 6 monthsActual 5.0 monthsFlagged · A. Sullivan
Every line can be traced back to the invoice against which it was drawn
Export Monitor Package
There are systems on the market that generate financing reports. These reports are generated within the borrower's environment. PROBIS is located on the bank's side.
Benchmarking in Detail

Compare like with like— and explain the difference.

The result is not a number, but a rationale. Villa A costs 13% more per square meter of gross floor area than Villa B—and you can see that the difference lies entirely in the facade, interior walls, and ceilings, because the comparison breaks it down precisely in those areas.

Select a comparison group.
Adjust for actual conditions.
Break down the difference.
Save and reuse.
Export.

An unadjusted comparison in euros per square meter is worthless

Cost Adjustment via the BKI Regional Factor and the Construction Price Index
Adjustment as of a specific date to ensure that older projects remain comparable
Comparison by cost group, type of use, asset class, and quality standard
Project selection by region, via map, or using filters
Comparison against the overall average, a peer group, or a comparison group you define
Benchmark Adjustment — Villa Isarhang → Elstervillen BA 2
BKI Regional Factor
Munich 1.24 → Leipzig 0.94
Construction Price Index (Destatis)
Base 2022 → 2026 · +14.2%
Asset Class
Housing · Villa
Quality Standard
high → high
Source · settled
3.100 €
per m² gross floor area · Munich · 2022 · KG 300+400
→
Adjusted · comparable
2.680 €
per m² of gross floor area · Leipzig · 2026 · same scope
0.94 / 1.24 Regional factor × 1.142 Construction price index × 1.00 Standard
Include in the calculation

Comparison Group · Housing/Villa, Southern and Eastern Germany, starting in 2022

€/m² Gross Floor Area · Net · Regionally Adjusted · Index 2026
Cost Group (DIN 276)Villa AVilla BVilla CTownhouse ATownhouse BVilla A vs. Ø Group
KG 320 Founding378369369333342+5,5 %
KG 330 Exterior Walls/Facade1,100outliers919927828846+19,0 %
KG 340–350 Interior Walls & Ceilings810Outliers639661558567+25,2 %
KG 400 Technical Systems550531558497504+4,2 %
KG 500 Outdoor Facilities189207180144135+10,5 %
KG 700 Incidental Construction Costs293286295243252+7,0 %
Total €/m² of gross floor area3.3202.9512.9902.6032.646+14,4 %
Ø Comparison group: €2,902.0/m² gross floor area · 5 projects · adjusted for Leipzig in 2026
Two cost categories account for 81% of the additional costs for Villa A

Benchmarks are imported into Calculate → when you calculate a new project, and into Contract → when you review a quote.

Benchmarking in Detail

Compare like with like— and explain the difference.

The result isn't a number, but an explanation. Villa A costs 13% more per square foot than Villa B—and you can see that the difference lies entirely in the structural work and interior finishing, because that's exactly where the comparison breaks it down.

Select a comparison group.
Adjust for actual conditions.
Break down the difference.
Save and reuse.
Export.

An unadjusted $/SF comparison is worthless

Cost Adjustment Based on Regional Factors and the Construction Price Index
Adjustment as of a specific date to ensure that older projects remain comparable
Comparison by cost group, type of use, asset class, and quality standard
Project selection by region, via map, or using filters
Comparison against the overall average, a peer group, or a comparison group you define
Benchmark adjustment — Villa Ridgeview → Sonoran Villas Phase 2
Regional factor
New York 1.00 → Phoenix 0.78
Construction Cost Index
Base 2022 → 2026 · +14.2%
Asset class
Residential · villa
Quality standard
Premium → Premium
Source · as-built
$374
via SF · New York · 2022 · UniFormat B+C
→
Adjusted · comparable
$320
via SF · Phoenix · 2026 · same scope
0.78 regional × 1.142 index × 0.96 standard
Request a Quote

Benchmark set · Residential villas, Northeast and Southwest, 2022 and beyond

$/sf · Net · Regionally adjusted · Index 2026
Cost group (UNIFORMAT)Villa AVilla BVilla CTownhouse ATownhouse BVilla A vs. set average
Substructure4241413738+5.5%
Superstructure123outlier1011039294+19.9%
Interior Finishes90outlier71736263+25.3%
Services6159625556+4.1%
Site Work2123201615+10.5%
Professional Fees3231322728+6.7%
Total $/sq ft369326331289294+14.7%
Average price of $321.8 per square foot · 5 projects · adjusted for New York in 2026
Two cost groups account for 82% of Villa A's excess

Benchmarks are imported into Calculate → when you calculate a new project, and into Contract → when you review a quote.

Audit & Governance

Will this stand up to scrutiny— without a reconstruction project?

Cost data is usually only verifiable in retrospect: someone spends three weeks reconstructing how a figure was arrived at. Manage continuously tracks this history and reports the same values in accordance with multiple accounting standards—HGB for general ledger entries, IFRS for consolidated and investor reporting, and US GAAP for international investors. This is precisely what shows the auditor that the system is built according to a standard and not based on personal preference.

HGB, IFRS, and U.S. GAAP Reporting

The costs are reported in the general ledger in accordance with the German Commercial Code (HGB). The same figures are used in IFRS consolidated and investor reporting, as well as in US GAAP reporting for international investors. Three accounting standards from a single data set—and that is precisely where the audit evidence lies.

Activation

Whether an item is subject to capitalization or recognized as an expense is determined based on rules at the transaction level; it is not reconstructed at year-end. Production costs, construction-period interest pursuant to Section 255 of the German Commercial Code (HGB), and incidental construction costs are treated accordingly—the value you report in the financial statements is already chargeable.

Audit-proof (GoBD-compliant)

Each value retains its creator, timestamp, and previous state. Nothing is overwritten without notice, and no number exists without the transaction that generated it—every value in every report can be traced back to its origin.

Audit Qualification for Certified Public Accountants

Read-only access with a defined scope, a complete change history, and reports that can be reproduced for any past date. The auditor works directly in the system rather than in a folder containing exported files.

Investor and Shareholder Reporting

Reports are generated on a fixed schedule based on current figures, in the agreed-upon format—the same figures used to manage the project, not a separately maintained set of data.

Audit & Governance

Will this stand up to scrutiny— without a reconstruction project?

Cost data can usually only be verified after the fact: Someone spends three weeks reconstructing how a figure was arrived at. Manage keeps track of this history on an ongoing basis and reports the same figures in accordance with US GAAP—and in accordance with IFRS if a parent company or international investors require it. This is exactly what shows your auditors that the figures follow a defined standard rather than personal judgment.

US GAAP and IFRS Reporting

The costs are recorded in your general ledger in accordance with U.S. GAAP. The same figures are used in IFRS reporting for international parent companies or investors—without the need for separate tables or manual reconciliation. Each standard is derived from a single data set, and that is precisely where the audit trail lies.

Activation

Whether a cost item is capitalized or recognized as an expense is determined based on rules at the transaction level and is not adjusted at year-end. Development costs, interest capitalized during the construction phase (ASC 835-20), and other real estate project costs (ASC 970) are treated consistently—meaning the amount on your balance sheet is already reliable.

Complete audit trail

Every value retains its creator, timestamp, and previous value. Nothing is overwritten without documentation, and no number exists without the transaction that generated it. Every value in every report can be traced back to its source—exactly the documentation that internal control audits such as SOX rely on.

Exam-Ready for Your CPA Firm

Reviewers are granted read-only access with a defined scope, a complete change history, and reports that can be reproduced for any past cutoff date. They work directly in the system instead of having to track down exported files.

Investor, Lender, and LP Reporting

Reports are generated on a regular basis using current figures, in the format agreed upon with investors and lenders. They are based on the same figures you use to manage the project—not on a separately maintained dataset.

how it works

Portfolio Standard
v3
Cost Variance
5% threshold
Delay
> 10 days
Report Template
Monthly Report v3
Roles
12 defined
Escalation
PL
→
BL
→
CEO
01

Define a frame

Define standards, thresholds, templates, roles, and escalation paths.

Projects
4
Southern Portfolio
Standard v3
P
Living Near the Train Station
✓ v3
P
Leo Leistikow Quarter
✓ v3
P
West Campus
✓ v3
P
Hotel Isar
+ own depth
02

Link Projects

Each project adopts the standard while maintaining its own depth.

Key Figures · Southern Portfolio
↻ live
Budget Variance
+2,1 %
Commitment Ratio
78 %
Cash Outflow
61 %
Schedule Deviation
−6 days
Drain
61 %
Recalculated 2 minutes ago based on actual data
03

Check on an ongoing basis

Key figures are recalculated based on current data, not on reports.

Warning W-118
⚠ Open
Cost variance +6.8%
Hotel Isar · KG 400 · Threshold 5%
BL
Construction Management
assigned
Deadline: 5 days
Due on
21.10.2026
Escalation to
Management
04

Report and Assign

Exceedances result in warnings that specify the person responsible and a deadline.

Decision Memorandum EV-12
Hotel Isar · KG 400 Additional Costs
A · Redesign of Building Services
+180,000 € · +3 weeks
Option
B · Renegotiation
+65,000 € · +1 week
✓ Selected
CEO
14.10.2026
✓ Documented
05

Decide

Decision-making documents outline options and consequences; the outcome is documented.

Why Problems Come as a Surprise

Today

  • —Each project reports in its own format, at its own pace, with its own sense of optimism.
  • —The portfolio review is a presentation created by the presenters themselves.
  • —Risk registers are maintained separately from financial data and become outdated after one month.
  • —Escalation depends on someone wanting to escalate the situation.

With PROBIS

  • Every project is managed according to the same thresholds—exceeding them has the same consequence across the board.
  • The review document is based on current data—its preparation is not an opportunity to reinterpret the data.
  • Reports are generated directly from the financial data and remain up to date—they cannot become outdated.
  • The comparison is reliable after adjusting for regional and index variations—a difference is an explanation, not a claim.

A structure that spans all projects

  • Project status indicator for progress, quality, and costs, calculated based on current data
  • Standardized report templates across the entire portfolio
  • Cross-project management views, with a link to "Control" for posting behind the number
  • Configurable roles, teams, and permissions by project and company
Standard Project Report — All Projects, One Structure
Portfolio · 12 projects
Showing 6 of 12 · template PF-01
ProjectStageBudgetForecast var.StatusUpdated
Riverside Tower IIConstruction203.1M−1.5%On trackToday
Harbor DistrictConstruction233.2M−4.2%WatchToday
Peachtree Galleria RenovationFit-out106.0M+0.4%On trackToday
Seaport Block E5Construction295.1M−7.8%WarningToday
Northside Block CDesign82.4M−0.2%On trackYesterday
Marina DistrictConstruction155.9M−2.1%WatchToday
Every column calculated from the same transaction model
Drill down to the transaction

Processes with clearly defined responsibilities

  • Project-specific workflows with teams for each step
  • Automatic Triggers and Batch Approvals
  • Task Overview by User, with Visible Processing Time
  • Complete decision history for review and handoff
Task Overview — 6 decisions pending across the portfolio
Pending steps
4 of 6 · sorted by waiting time
Change Order NA-14 · Release
Seaport Block E5
VP of Construction
22 days · escalated
Quality gate · facade mock-up
Harbor District
Technical Lead
11 days
Budget Revision v9 · Approval
Marina District
Director of Project Management
11 days
Award recommendation · bid package 400
South Medical Center
Procurement
4 days
Escalation fires automatically after 21 days
Complete decision history

Take Control Instead of Just Reporting

  • Decision Templates Based on Current Project Data
  • Scenario Comparison at the Portfolio Level
  • Thresholds and Tolerances by Project and Program
  • Commenting and voting directly on the numbers
Decision Template — Seaport Block E5 · Facade Package
Facade Supplier Declares Bankruptcy — Three Options Moving Forward
Board decision · due September 4
Option A
Assign the subcontract
Cost
+$2.6M
Cash
+$1.0M
Schedule
+6 weeks
Option B
Rebid the remaining scope
Cost
+$1.8M
Cash
−$0.4M
Schedule
+11 weeks
Recommended
Option C
Split the package between two transactions
Cost
+$3.4M
Cash
+$1.9 million
Schedule
+4 weeks
BaseForecast v8 · live
Contingency remaining$5.4 million
OutcomeRecorded at the time of the decision

A structure that spans all projects

  • Project status indicator for progress, quality, and costs, calculated based on current data
  • Standardized report templates across the entire portfolio
  • Cross-project management views, with a link to "Control" for posting behind the number
  • Configurable roles, teams, and permissions by project and company
Standard Project Report — All Projects, One Structure
Portfolio · 12 Projects
6 of 12 · Template PF-01
ProjectPhaseBudgetForecast VarianceStatusStatus
Mainufer Tower IIConstruction203,1−1,5 %On ScheduleToday
Harbor DistrictConstruction233,2−4,2 %ObserveToday
Isarpassage RevitalizationExpansion106,0+0,4 %On ScheduleToday
Hafenquartier Construction Lot E5Construction295,1−7,8 %WarningToday
Nordstadt Block CPlanning82,4−0,2 %On ScheduleYesterday
Rheinauhafen NeighborhoodConstruction155,9−2,1 %ObserveToday
All figures in millions of euros · identical structure for each project
Jump to Control

Processes with clearly defined responsibilities

  • Project-specific workflows with teams for each step
  • Automatic Triggers and Batch Approvals
  • Task Overview by User, with Visible Processing Time
  • Complete decision history for review and handoff
Task Overview — 6 Pending Decisions in the Portfolio
Open Steps
4 of 6 · by layover time
Addendum NA-14 · Approval
Hafenquartier Construction Lot E5
Construction Management
22 days · escalated
Quality Approval · Facade Samples
Harbor District
Technical Director
11 days
Budget Update v9 · Approval
Rheinauhafen Neighborhood
Project Management Division
11 days
Award Recommendation · Award Package 400
South Medical Center
Purchasing/Contract Awarding
4 days
Escalation occurs automatically after 21 days
Complete History

Take Control Instead of Just Reporting

  • Decision Templates Based on Current Project Data
  • Scenario Comparison at the Portfolio Level
  • Thresholds and Tolerances by Project and Program
  • Commenting and voting directly on the numbers
Proposal for Decision — Harbor District Construction Lot E5 · Facade Package
Facade Contractor Files for Bankruptcy — Three Options
Management Decision · Due September 15, 2026
Option A
Transfer a Subcontract
Costs
+2.6 million euros
Cash flow
+1.0 million euros
Dates
+6 weeks
Option B
Re-advertise the remaining work
Costs
+1.8 million euros
Cash flow
−0.4 million euros
Dates
+11 weeks
Recommended
Option C
Split the package into two contracts
Costs
+3.4 million euros
Cash flow
+1.9 million euros
Dates
+4 weeks
BasisForecast v8 · current
Remaining reserve€5.4 million
ResultTo be documented
InOut
PROBIS manage Live
All project data from Calculate, Contract, Control, and Rent & Sell
Loan Agreements and Covenants
Schedule data
Facility Agreements and Draw Schedules
Warning feed
Board and Investor Reports
Lender Draw Packages
Decision Templates
Portfolio dashboards
project data warnings decisions covenants drawdown schedule board pack cash flow dashboards

Also in Manage

Compress Program Level

Manage multiple projects as a single business unit.

Separation by Company and Client

Multiple companies in a single client environment, clearly separated.

Custom KPIs

You determine what your company focuses on.

Milestone Trend Analysis

Delays as a Cost Indicator.

Auditable History

All values, creators, and timestamps are preserved.

Investor and Shareholder Reporting

Based on current data, on a regular basis.

Team and Role Management

Authorization levels and project scope by team.

Notification Rules

Who finds out what—and how quickly.

Comparison of Stands

This month, compared to any previous figure.

Case Studies · Manage

Four programs, one overview.

From a Manhattan landmark to Munich Airport to a healthcare real estate operator. Select a project to learn more.
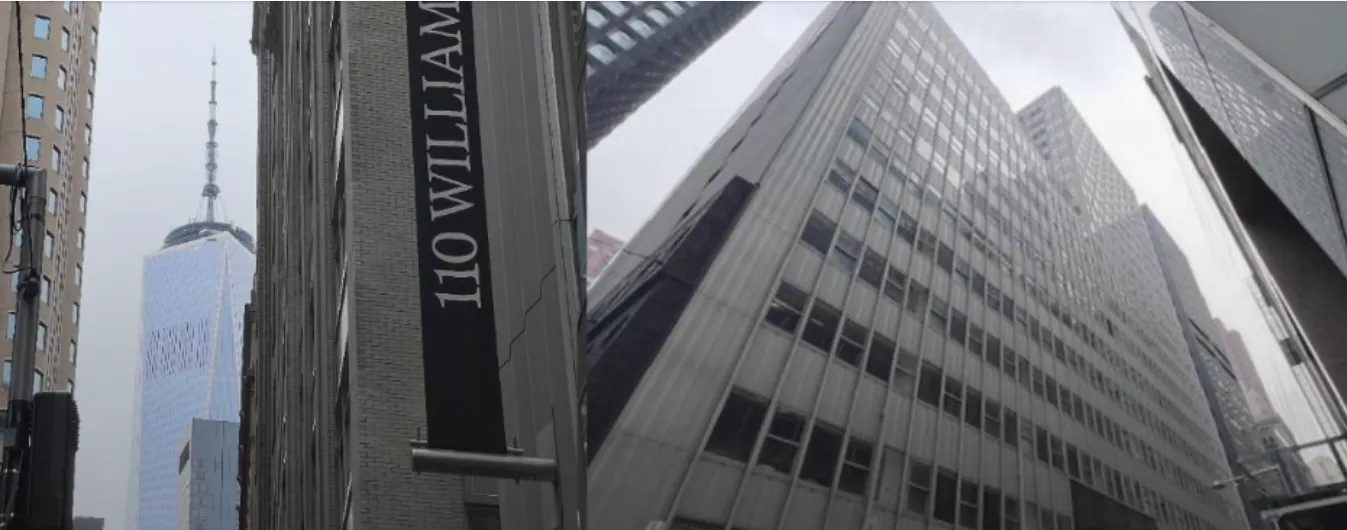
110 William Street, New York
01 / 04
110 William Street
New York, NY
Case Study · Modernization of a Historic Office Building

Steering a 32-story Manhattan landmark, week by week.

110 William Street is a historic 32-story office tower in Lower Manhattan, built in 1918 and expanded in 1959, which is currently undergoing a comprehensive modernization to prepare over 640,000 square feet for the New York City Administration for Children's Services. PROBIS supports the redevelopment with its digital monitoring platform—providing stakeholders with a transparent, real-time view of the budget and schedule throughout the project's lifecycle.

Read the full project profile →
Original construction1918
Building height32 stories
Modernized space640,000+ sq ft
Tenant
NYC Administration for Children's Services
Size
640,000+ sq ft
Built
1918 · expanded in 1959
Modules
Manage
Munich Airport Terminal 1 Expansion
02 / 04
Munich Airport Terminal 1
Munich, Germany
Case Study · Airport Expansion

A 1,050-foot pier, with every package carefully guided across it.

Munich Airport is expanding Terminal 1 with a new pier and a central building complex. The pier connects to Modules A and B and extends 1,050 feet into the western apron. Its new gate area can accommodate up to 12 aircraft, two of which are Airbus A380s. PROBIS provides Germany’s second-largest hub with a single, comprehensive view of the program, with Calculate, Contract, and Control all drawing on the same underlying data.

Read the full project profile →
New pier1,050 ft
Aircraft stands12
A380 stands2
Project
Terminal 1 Expansion
Pier
1,050 ft
Connects to
Modules A and B
Modules
Calculate · Contract · Control · Manage
Andaz Vienna at the Belvedere
03 / 04
Andaz Vienna at the Belvedere
Vienna, Austria
Case Study · Hospitality

303 rooms, one live liquidity plan for the banks.

Andaz Vienna Am Belvedere is a Hyatt hotel designed by Renzo Piano. Its buildings are connected by bridges surrounding an open ground-floor lobby, and it features a rooftop bar overlooking the city. PROBIS Project-Clock was implemented for the financing banks via the project monitor to plan cash outflows and liquidity. Cloud-based use-of-funds monitoring runs in the Finance Dashboard.

Read the full project profile →
Rooms303
Conference areaapprox. 23,700 sq ft
LenderDeutsche Pfandbriefbank
Operator
Hyatt
Architect
Renzo Piano
Lender
Deutsche Pfandbriefbank
Modules
Manage · Project Clock
MCR, Göttingen
04 / 04
MCR
Göttingen, Germany
Case Study · Healthcare Real Estate

One controlling platform, audit-ready from day one.

MCR, a healthcare real estate operator in Göttingen, replaced fragmented spreadsheets with centralized financial management on PROBIS. An integration with DATEV enables bidirectional data exchange without duplicate entry, so the figures used to manage the business are the same ones the accountants record. Reporting is audit-ready by design rather than having to be reconstructed at year-end.

Read the full project profile →
IntegrationDATEV
Data exchangeBidirectional
ReportingAudit-ready
Client
MCR
Integration
DATEV
Location
Göttingen, Germany
Modules
Manage
All case studies
Case Studies · Manage

Four programs, one control view.

From a Manhattan landmark to Munich Airport to a healthcare real estate operator. Select a project to learn more.

110 William Street, New York
01 / 04
110 William Street
New York
Case Study · Historic Office Building

A 32-story landmark in Manhattan—in plain sight week after week.

110 William Street is a 32-story, landmarked office tower in Lower Manhattan, built in 1918 and expanded in 1959. As part of a comprehensive modernization project, over 59,000 m² are being renovated for the New York City Administration for Children’s Services. PROBIS is supporting the revitalization with its digital monitoring platform, providing all stakeholders with a transparent, up-to-date overview of costs and schedules throughout the entire project.

Read the full project profile →
Year of manufacture1918
Building height32 stories
Modernized areaover 59,000 m²
Users
NYC Administration for Children's Services
Size
over 59,000 m²
Year of manufacture
1918 · expanded in 1959
Modules
Manage
Munich Airport, Terminal 1 Expansion
02 / 04
Munich Airport Terminal 1
Munich
Case Study · Airport Expansion

A 320-meter-long pier, controlled via all packages.

Munich Airport is expanding Terminal 1 with a new pier and a central building complex. The pier connects to Modules A and B and extends 320 meters into the western apron. The new gate area can handle up to 12 aircraft, including two Airbus A380s. PROBIS provides Germany’s second-largest hub with an overview of the entire program—Calculate, Contract, and Control all draw on the same data.

Read the full project profile →
New Pier320 m
Aircraft Positions12
A380 Positions2
Project
Terminal 1 Expansion
Pier
320 m
Connection
Modules A and B
Modules
Calculate · Contract · Control · Manage
Andaz Vienna at the Belvedere
03 / 04
Andaz Vienna at the Belvedere
Vienna
Case Study · Hospitality Industry

303 rooms, an ongoing liquidity plan for the banks.

The Andaz Vienna Am Belvedere is a Hyatt hotel designed by Renzo Piano. Its buildings are connected by bridges surrounding an open lobby on the ground floor, with a rooftop bar overlooking the city. PROBIS Project-Clock was used via the project monitor for the financing banks to plan cash outflows and liquidity. Cloud-based monitoring of fund usage is handled in the Finance Dashboard.

Read the full project profile →
Rooms303
Conference space2,200 m²
FinancingDeutsche Pfandbriefbank
Operator
Hyatt
Architecture
Renzo Piano
Financing
Deutsche Pfandbriefbank
Modules
Manage · Project Clock
MCR, Göttingen
04 / 04
MCR
Göttingen
Case Study · Healthcare Real Estate

A controlling platform that’s audit-ready from day one.

MCR, a healthcare real estate operator in Göttingen, has replaced scattered spreadsheets with a centralized controlling system in PROBIS. A DATEV integration ensures bidirectional data exchange without duplicate entry—the figures used to manage the company are the same ones recorded by the accounting department. Reporting is audit-ready from the ground up, rather than having to be reconstructed at the end of the year.

Read the full project profile →
IntegrationDATEV
Data ExchangeBidirectional
ReportingExam-Ready
Client
MCR
Integration
DATEV
Location
Göttingen
Modules
Manage
All Case Studies

Frequently Asked Questions

What exactly can the AI Report Builder generate?

Any report you can describe: monthly variances across a project group, a summary of changes exceeding a threshold, a cash flow view for the financing bank. You specify projects and sources—cost estimates, contracts, invoices—and the report is generated from scratch and kept up to date with each new data set.

Are reports generated anew, or are they kept up to date?

They stay up to date. A report is a persistent query on the same entries that also form the basis of the cost report—it updates as soon as new cost data becomes available. There is no generation step and no version that becomes outdated without anyone noticing.

Can we apply different standards to different departments within the company?

Yes. Standards, workflows, thresholds, and permissions can be defined by company, client, or project type, yet they all come together in a single portfolio view.

How does this support reporting to the financing bank?

Fund disbursements, statements of equity, and funding coverage are included in Cash Flow and Liquidity. The view for the bank or the bank’s project monitor is derived from the same data used to manage the project—making it verifiable rather than compiled.

How do cash flow and liquidity relate to the Control module in this context?

"Manage" is the control level: thresholds, funding coverage with assigned personnel, and aggregation across all projects in the portfolio. "Control" handles the underlying transactions and the detailed cash flow model from which these values are calculated—an alert here opens directly to the transaction that triggered it.

How early would you have realized it?

Bring in a project that went off the rails. We'll show you where the warning signs were and when PROBIS would have alerted you to them.